The Forex market is the largest financial market in the world, where trillions of dollars are traded daily. Many investors who do not trade themselves invest their money in professional Forex funds. But just investing money is not enough; it is equally important to understand and evaluate the performance of the fund. Every investor wants their money to be safe and also get a good return on it, but both these things are possible only when you do a detailed analysis of the fund and understand whether the fund is working according to your goals or not.
The purpose of this blog is to make you aware of the performance metrics used to measure the success of forex funds. Often people make decisions just by looking at the return but ignore the risk, consistency and strategy behind that return. This is why many times investors face losses.
If you understand these metrics then you can make better decisions, control your risk and achieve your financial goals more effectively. This introduction will prepare you for the upcoming sections where we will examine these metrics in detail and see how you can use them to become a smart investor.
Understanding Key Performance Metrics in Forex Funds:
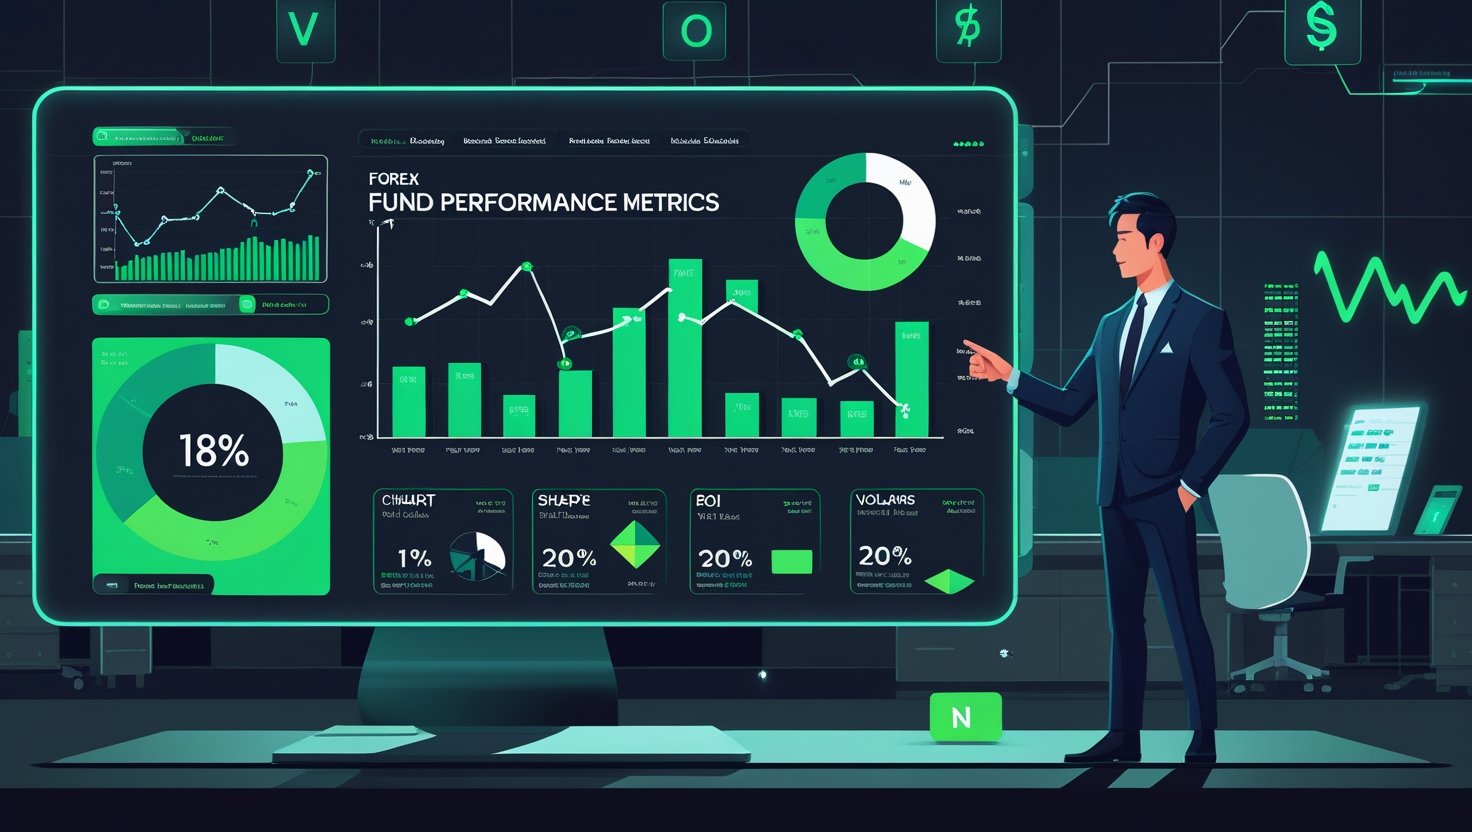
Some specific metrics are used to evaluate the performance of forex funds that tell you to what extent your invested money is profitable. The most common metric is Return on Investment (ROI). It means how much profit you got on your invested money. If you invested 1 lakh rupees and got 1 lakh 20 thousand by the end of the year, then your ROI is 20%.
Another important metric is Compound Annual Growth Rate (CAGR). This metric tells you how much return your fund gave on average every year. With the help of CAGR you can accurately measure long-term performance.
Drawdown is also a very important metric. It tells when and how much the value of the fund fell. If at any point of time the loss on your investment was 30% then the drawdown was 30%. It measures the level of risk the fund takes.
The main metric is the Sharpe Ratio. It tells you how much risk was taken in exchange for the return given by your fund. If the Sharpe Ratio is high, it means that the fund gave good returns with minimum risk. Every investor needs to understand these metrics because on their basis you can rationalize your investment decisions.
Risk-Adjusted Returns – Measuring Profit with Context:
It is important to earn profit in forex funds, but it is even more important to understand the risk behind that profit. This concept is called risk-adjusted return. It means how much profit your fund is earning by taking risks. Just looking at profit can be misleading if too much risk is also taken along with it. For this reason some special ratios are used such as Sharpe Ratio and Sortino Ratio.
Sharpe Ratio measures how much return the fund has given against the risk. Its formula is (Return – Risk-Free Rate) / Standard Deviation. If the Sharpe Ratio is high, it means you got better returns with less volatility.
The Sortino Ratio is a similar metric, but it only considers negative volatility, meaning it only looks at situations where the value of the fund falls. It is considered more accurate because not all volatility is bad – sometimes there is upside volatility too.
The advantage of risk-adjusted return is that you get a clearer picture of the fund’s performance. It helps you choose safe and stable options where your money is secure and long-term growth is possible. Unless you understand the risk in context, you cannot make accurate decisions. That is why every serious investor should understand this concept.
Evaluating Long-Term Stability:
The success of a forex fund is not measured by its performance over a single month or year. Real success is achieved when the fund shows consistent performance over multiple years. Specific methods are used to evaluate this consistency, such as Rolling Returns, Monthly Returns, and Year-on-Year (YoY) Performance.
Rolling Returns means you look at the performance of a fund every month over a period of time such as 3 years, 5 years. This determines whether the fund has consistently given returns or has performed well only during a specific period. If the fund has given stable returns in every rolling period, it means the fund is reliable.
Monthly and Yearly return reports are also very helpful. If the fund has shown good growth every month or every year without any major drop, it means the risk is being managed and the fund is suitable for the long term.
Consistency does not mean that the fund will never incur losses, but it is important that losses are under control and recovery is fast. Investors should give preference to funds that give stable and predictable returns in the long term. This is a powerful signal for every investor that the fund is trustworthy and under professional management.
Benchmarking and Peer Analysis:
Often investors think that if a fund is giving 15% return then it is the best, but in reality you should see how other similar funds performed in the same period. This analysis is called benchmarking and peer comparison. Benchmarking means that you compare your fund with a standard index or performance level. If the fund has performed better than the benchmark, then it is considered an outperformer.
Peer analysis means that you compare similar category funds with each other. For example, if your fund is a conservative forex fund, then it should not be compared with an aggressive growth fund. You should compare it with other funds in the same category to see which fund is more consistent, risk-controlled, and profitable.
During comparison, you should not only look at returns but also analyze drawdown, Sharpe ratio, and consistency. This way, you get a real picture of which fund fits your financial goals and risk tolerance. Both benchmark and peer analysis give you a solid basis for making investment decisions. This prevents you from making biased decisions, and you have clear data to evaluate.
Conclusion:
Investing in forex funds can be a lucrative option, but without analyzing performance metrics, it can prove to be risky. In this blog, we have seen how metrics like ROI, CAGR, Drawdown, and Sharpe Ratio give you the real picture of the fund. Risk-adjusted returns give you an idea of the level of risk with which the profit has been generated. Apart from this, consistency over time tells you how stable the fund is and whether it performs well only in the short term or is also dependable in the long term.
Peer comparison and benchmarking allow you to understand whether your selected fund is performing better than the market average. All of these tools make you an empowered investor who makes decisions based on data and logic.
In today’s dynamic forex environment where the market is changing daily, making informed decisions has become increasingly important. By understanding and applying these metrics, you can better direct your investments, minimize losses, and achieve your financial goals. Ultimately, analyzing performance metrics is not just a technical process, but a vital part of your financial future. Every investor should understand these tools and use them wisely.
FAQs:
- What is the most important metric to evaluate Forex fund performance?
The most commonly used metric is Return on Investment (ROI), which shows how much profit you earned on your invested amount. However, just looking at ROI is not enough. Metrics like the Sharpe Ratio, Compound Annual Growth Rate (CAGR), and Drawdown are also crucial to understand the fund’s risk and consistency. - What is the difference between the Sharpe Ratio and the Sortino Ratio?
The Sharpe Ratio measures returns against overall volatility, while the Sortino Ratio focuses only on negative volatility (downside risk). Both are used to understand risk-adjusted returns, but the Sortino Ratio is considered slightly more accurate because it doesn’t penalize positive market movements. - What does long-term consistency mean and why is it important?
Long-term consistency means the fund has delivered stable returns over several years, not just during one or two good phases. Tools like rolling returns, monthly performance, and year-on-year (YoY) analysis help measure this. Consistent performance indicates that the fund is professionally managed and suitable for long-term goals. - How do benchmarking and peer analysis help in evaluating a fund?
Benchmarking involves comparing your fund with a standard market index, while peer analysis means comparing it with similar category funds. This helps determine whether your fund is outperforming the market and how it stacks up against other similar investment options in terms of returns, risk, and consistency. - Is it wise to invest in a fund just based on high returns?
No, investing solely based on high returns can be risky. It’s important to analyze the risk taken to achieve those returns, the fund’s consistency, and its long-term performance. Using risk-adjusted metrics and comparison tools ensures more informed and safer investment decisions.